Dashboard Apps
Client Monitor
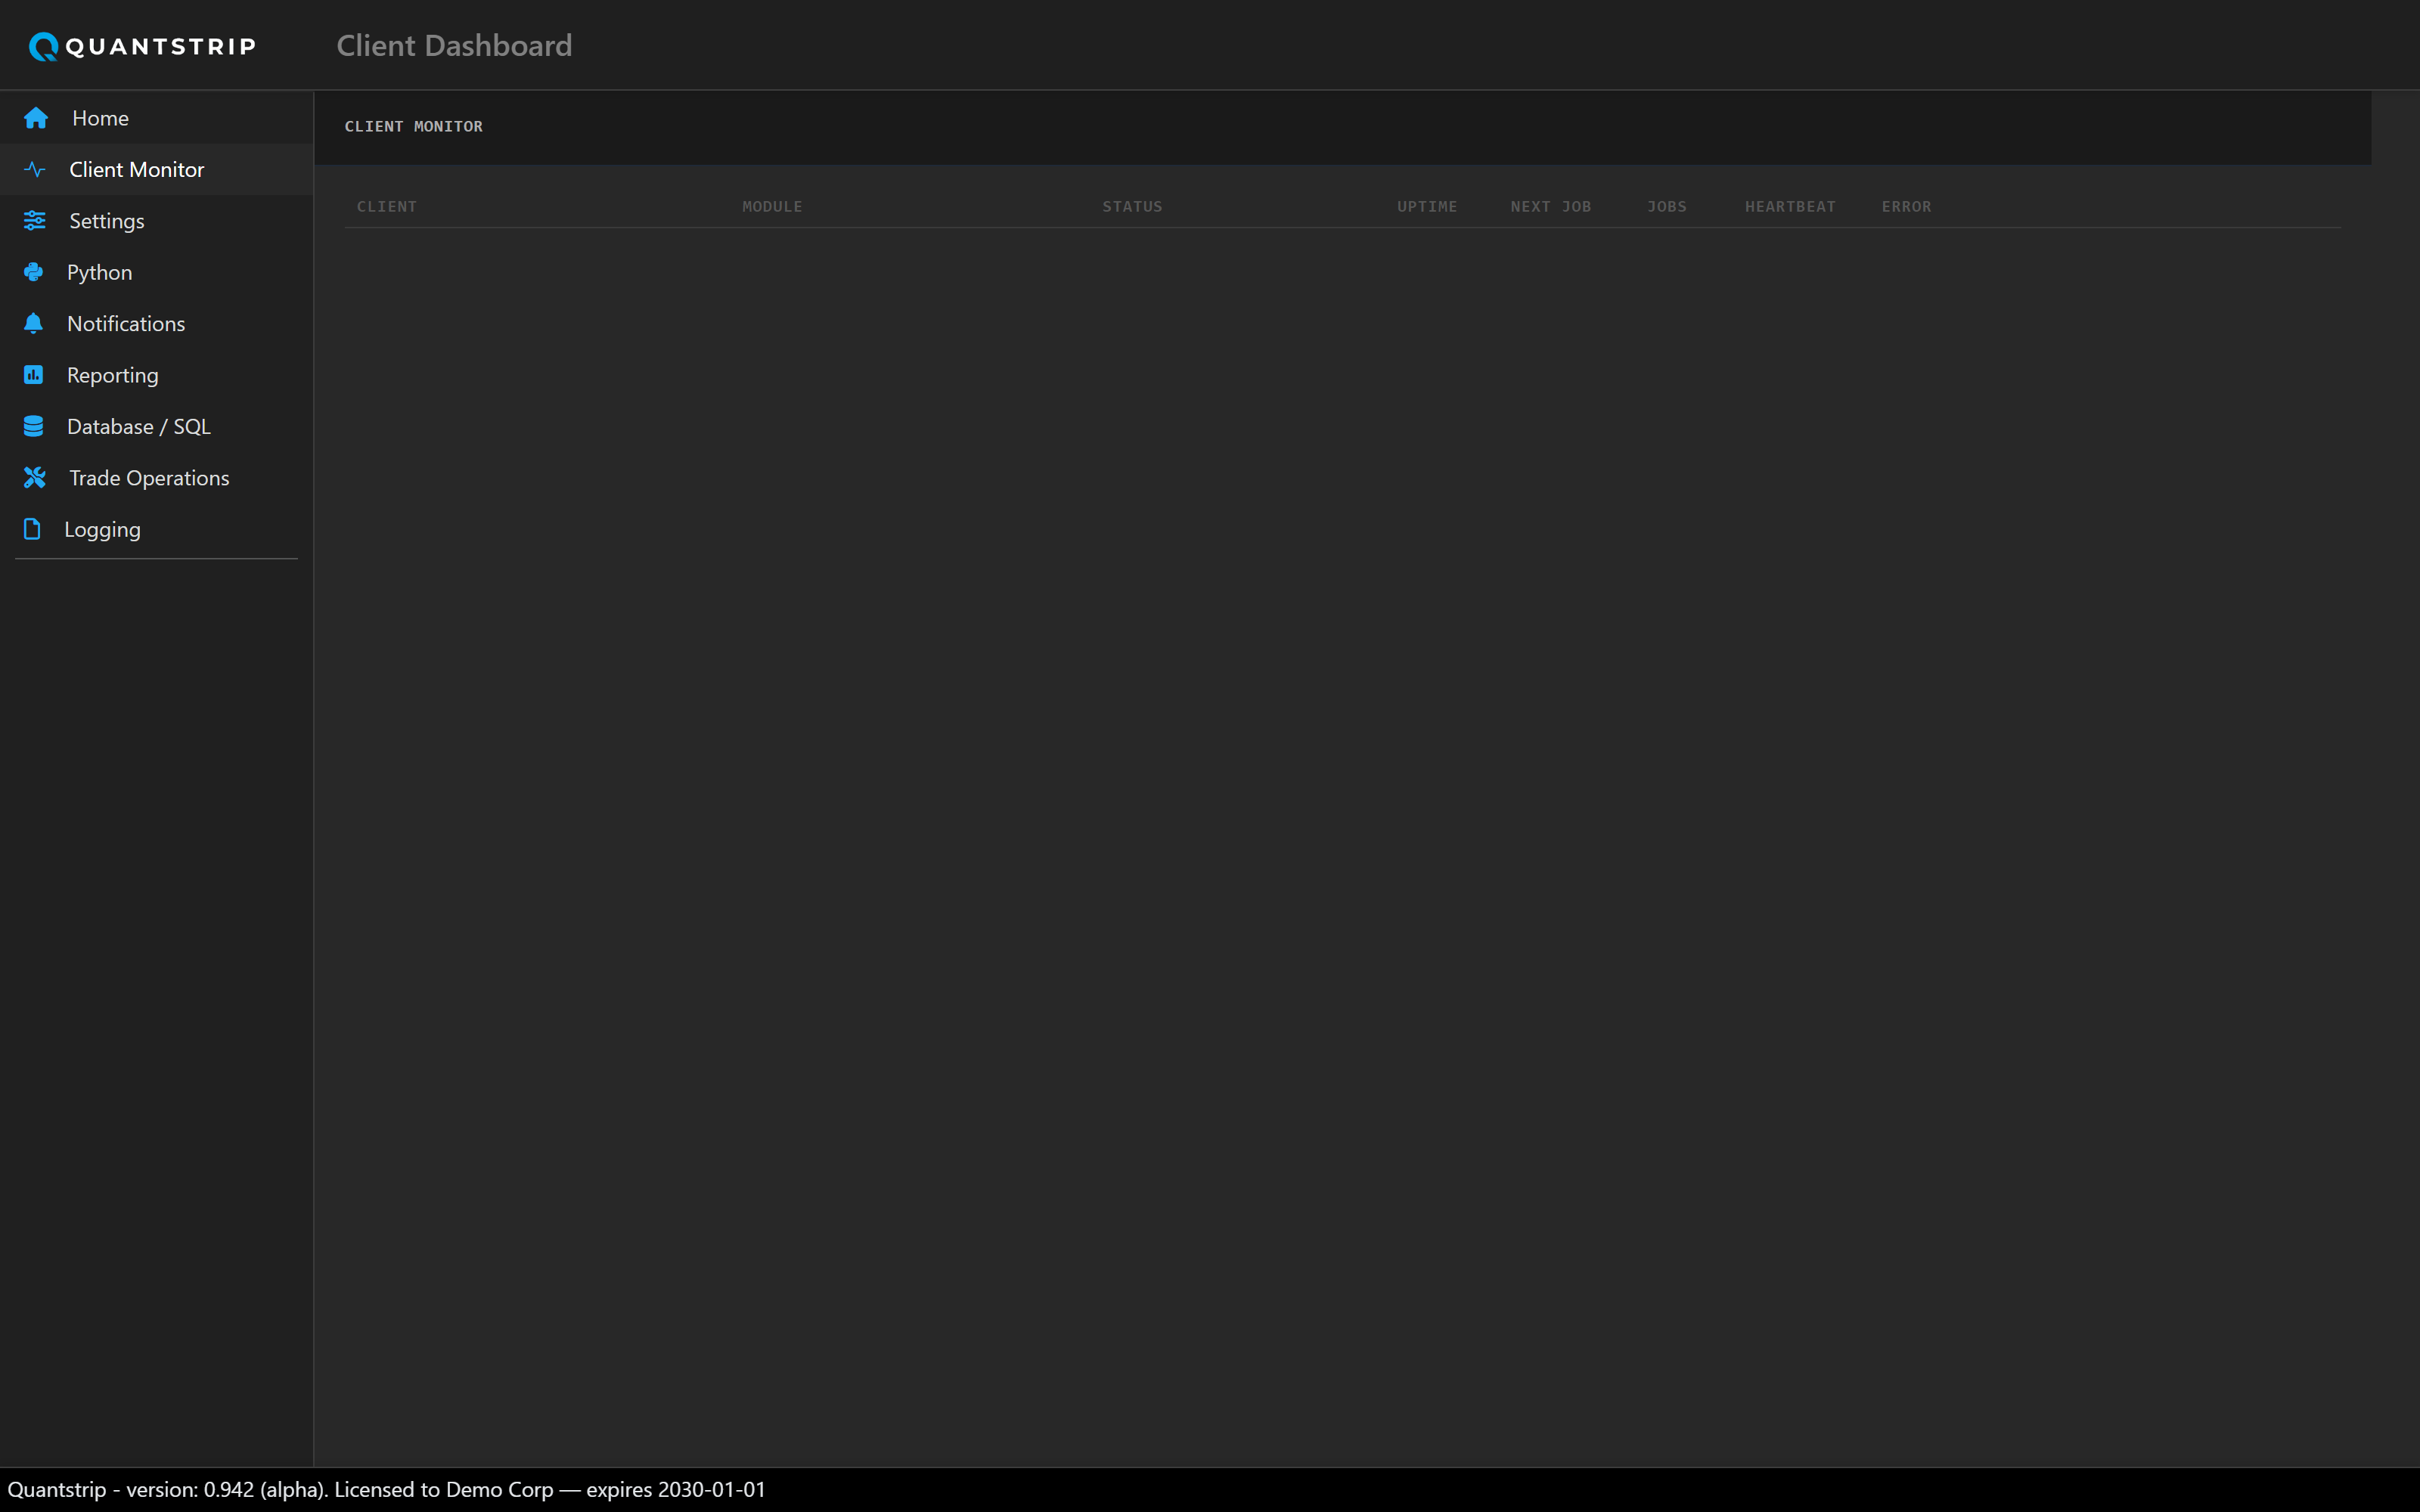
The dashboard's home page (route /): a live-refreshing grid of
every loaded client and its health, refreshed once a second.
assets/screenshots/client_monitor_overview.png
Screenshot not yet added — drop the file above into
docs/assets/screenshots/ and it will appear here automatically.
Each row is one loaded client, with a Start/Stop control, job count, and heartbeat age. A summary bar at the top of the page shows a pill count per status across all clients, and a separate "Problems" section lists clients whose module failed to import, each with a Reload button.
Status vocabulary
| Status | Meaning |
|---|---|
| Running | Client is loaded and its main loop is active. |
| Degraded | Running, but its last scheduled job raised an error. |
| Stopped | Loaded but not running — stopped intentionally or never started. |
| Not Responding | Marked running, but its heartbeat has gone stale for more than 10 seconds — a "zombie" thread. |
| Load failed | The client's Python module failed to import at all — shown separately in the Problems section with a Reload action. |
Clicking an error cell displays the full traceback for that client's most recent error.
Client Monitor displays service-level state only: heartbeat, job count, last error. It does
not inspect client-specific trading logic or position state. For strategy-vs-broker position
reconciliation, see Trade Operations.