Dashboard Apps
Reporting
Portfolio-level performance across every strategy: four headline KPIs and a three-panel chart, computed live from realized execution and commission data.
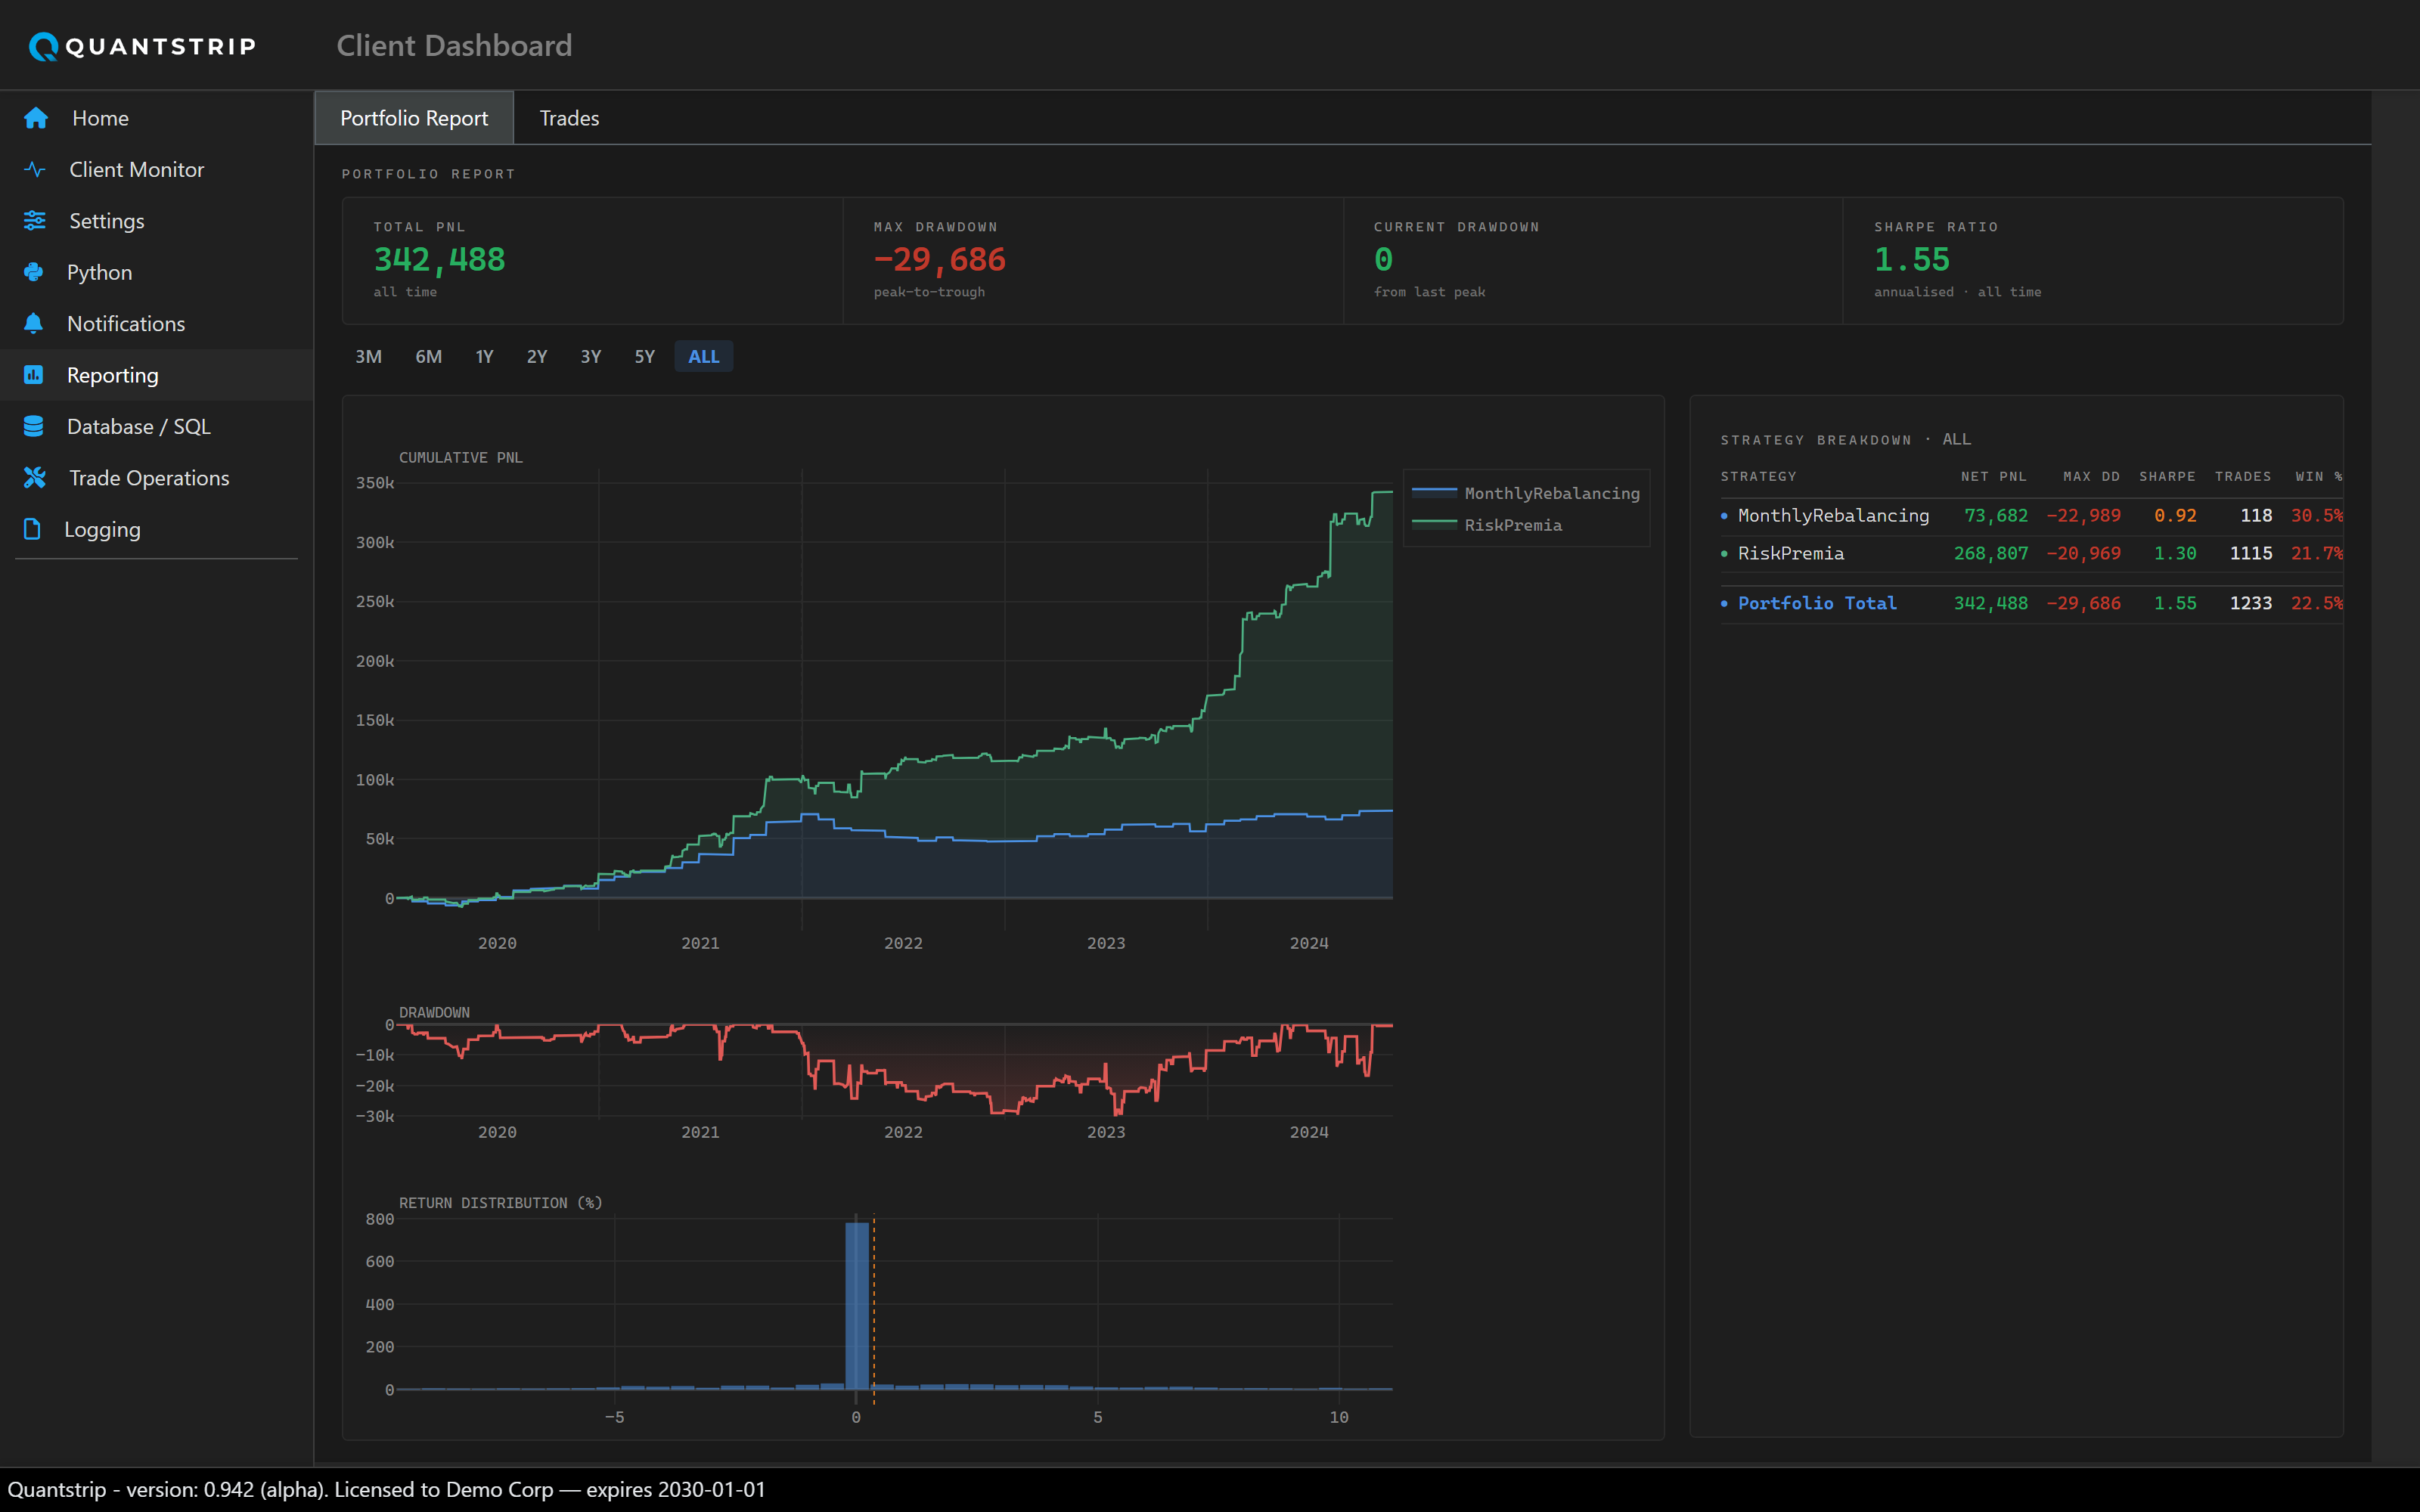
assets/screenshots/reporting_overview.png
Screenshot not yet added — drop the file above into
docs/assets/screenshots/ and it will appear here automatically.
Time horizon
A horizon picker at the top of the page scopes every KPI and chart to a rolling window:
3M, 6M, 1Y, 2Y, 3Y,
5Y, or ALL (the default).
KPI strip
| Tile | What it measures |
|---|---|
| Total PnL | Realized PnL across all strategies for the selected horizon. |
| Max Drawdown | Largest peak-to-trough decline in cumulative PnL over the horizon. |
| Current Drawdown | Decline from the most recent peak to the latest value. |
| Sharpe Ratio | Risk-adjusted return over the selected horizon. |
Charts
Below the KPIs, a stacked three-panel chart:
- Cumulative PnL — a stacked-area equity curve, one series per strategy.
- Drawdown — running drawdown derived from the same cumulative series.
- Return Distribution — a histogram of period returns, in percent.
Values are computed from execution joined with commission and
strategy. Realized PnL is SUM(commission.realized_pnl − commission.amount),
grouped by strategy and day, queried via DBHandler.run_query. No pre-aggregated
reporting table exists; all values derive from the same execution ledger used elsewhere in the
application.
A "Trades" tab exists on this page but is not yet implemented; it displays a placeholder.