Logging
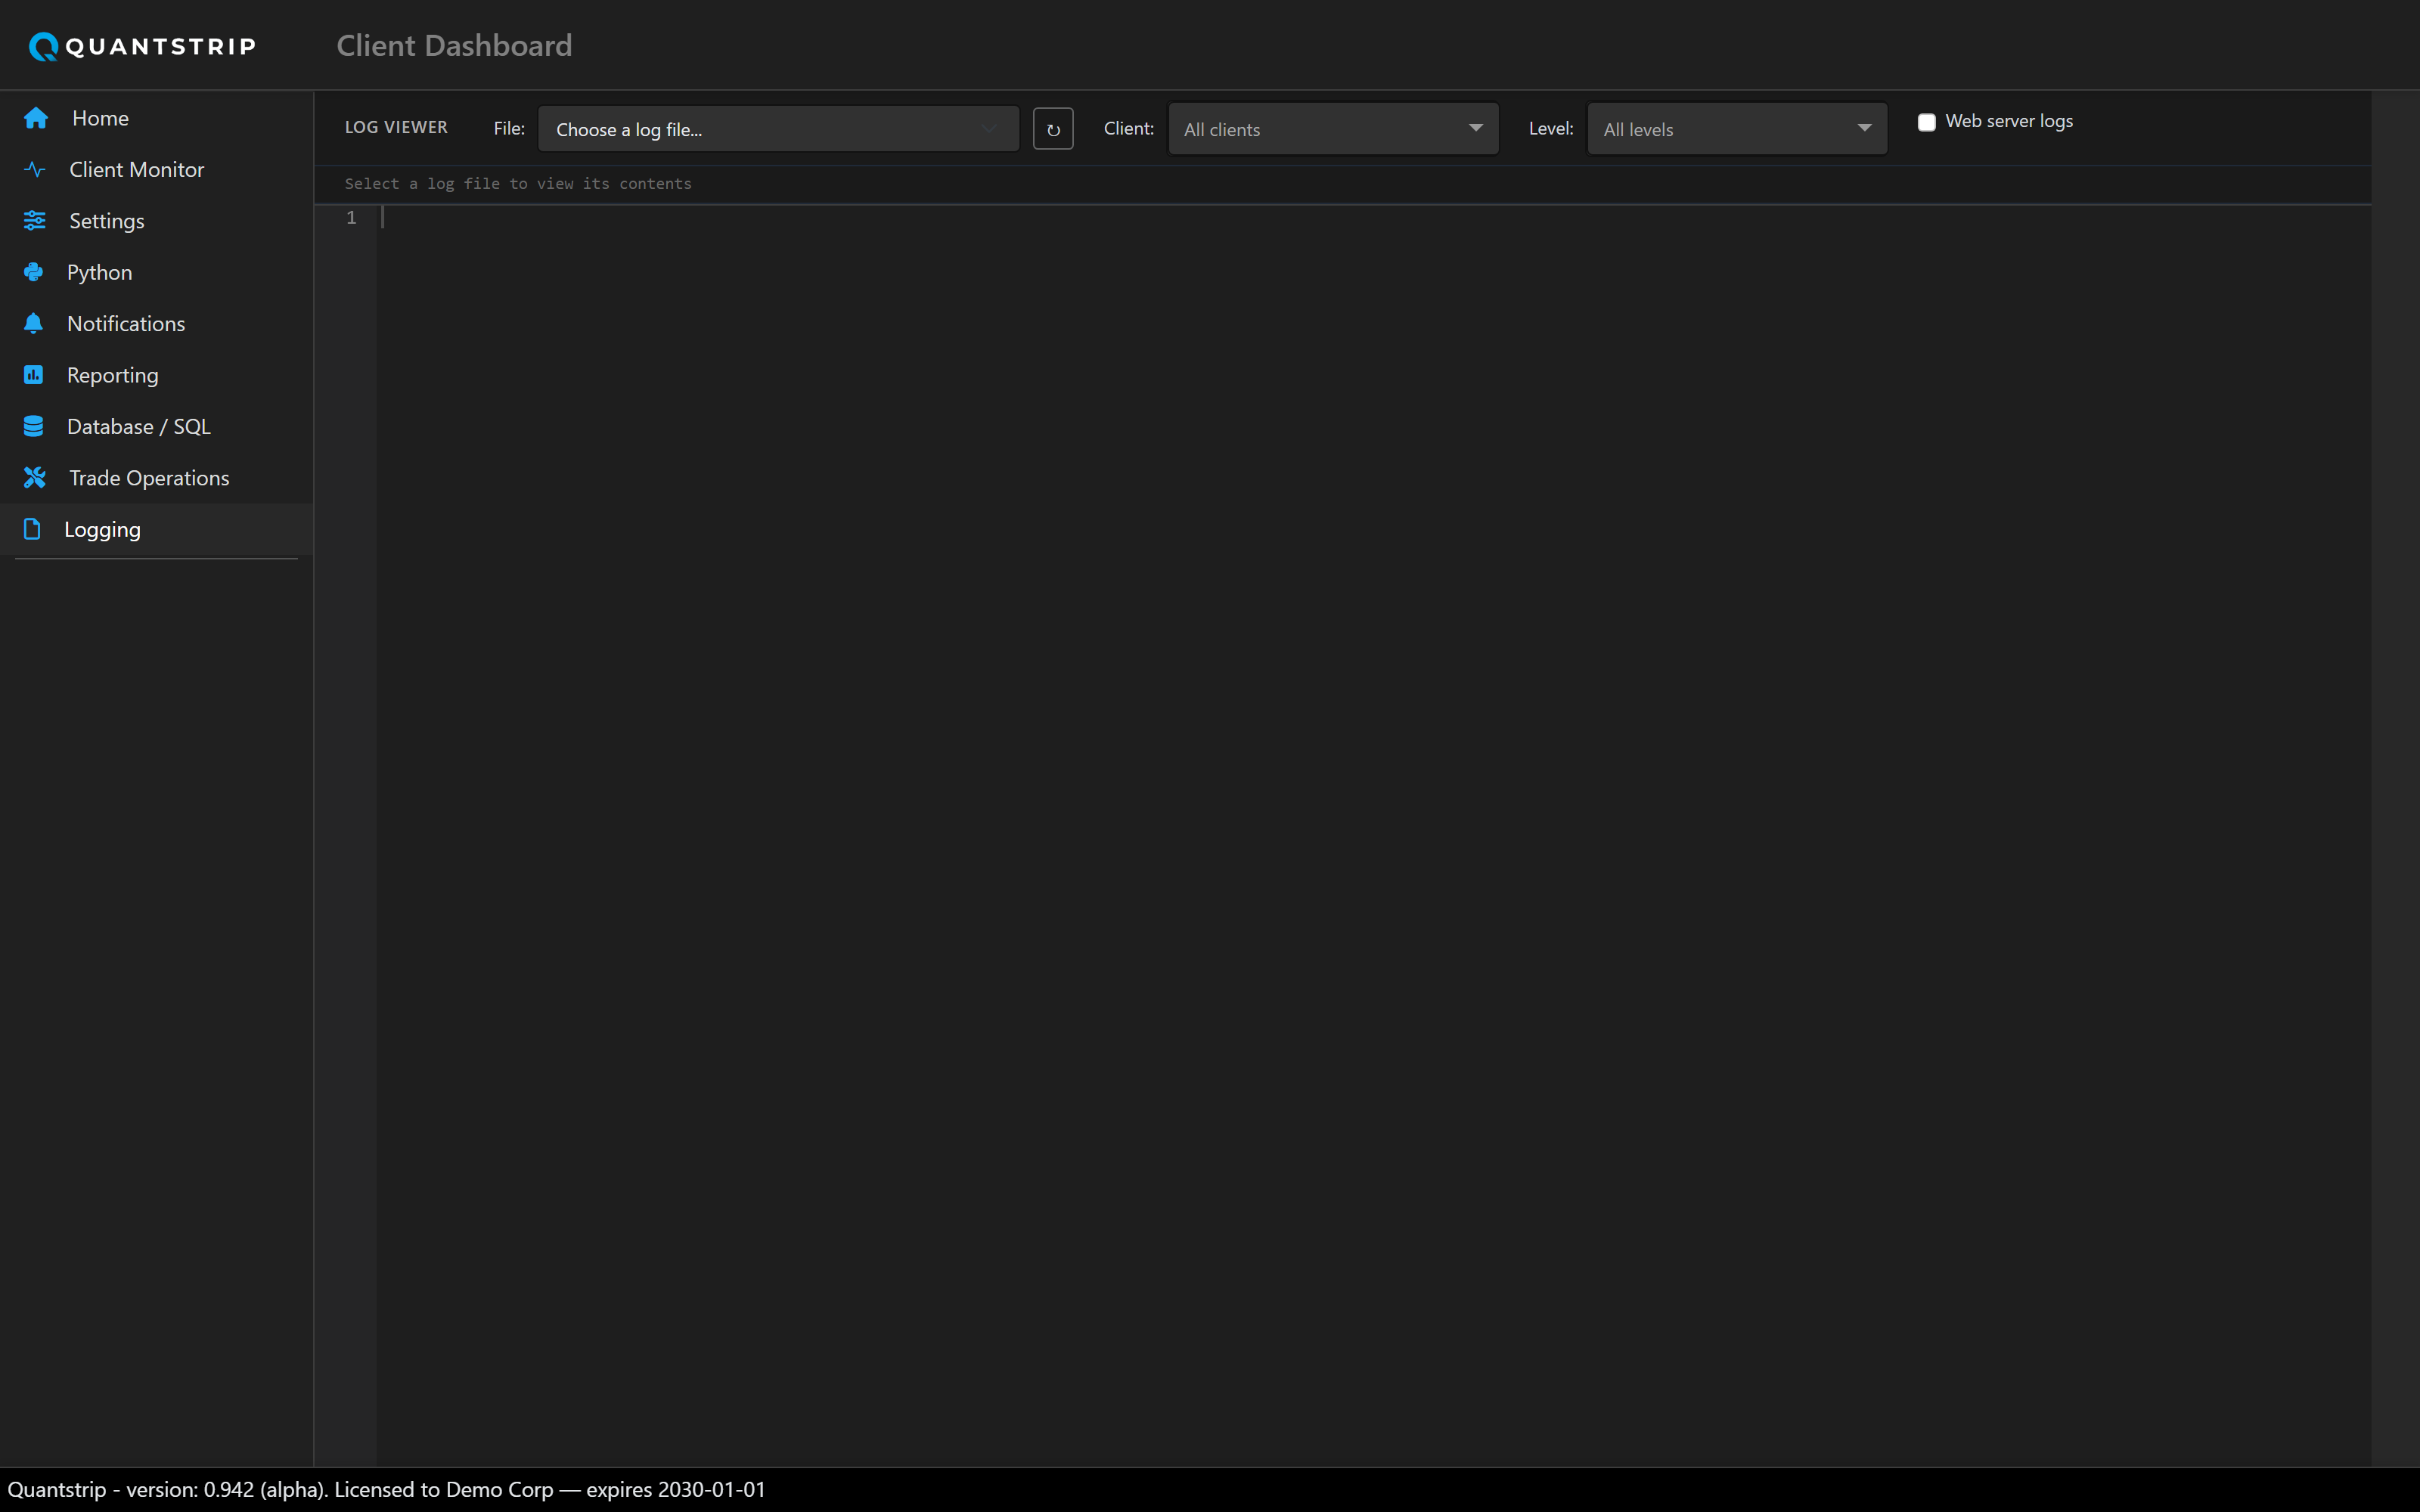
A read-only viewer over Quantstrip's log files, with filters for file, client, and level.
docs/assets/screenshots/ and it will appear here automatically.
Log files
The "log file" dropdown lists files under the app's Data\logs\ folder. This is
not one file per client — it's one file per service/log stream (e.g.
service.log). Web-server logs are hidden by default behind a "Web server logs"
checkbox.
Client and level filters
Within a loaded file, log lines are parsed as
DATETIME - LEVEL - CLIENT - ... - MESSAGE. The Client dropdown is populated from
client names present in the currently loaded file. Traceback lines that continue a
structured line inherit that line's filter state, preventing a level filter from splitting a
multi-line traceback. Recognized levels: DEBUG, INFO,
WARNING, ERROR, CRITICAL.